Uploaded image for project: 'SAFe Program'
  1. SAFe Program
  2. SP-4501

Improve SDP Taranta dashboard user experience

Change Owns to Parent OfsSet start and due date...
    XporterXMLWordPrintable

Details

    • Enabler
    • High
    • PI24
    • COM SDP SW
    • None
    • True
    • Data Processing
    • Hide

      As an AIV Engineer / Telescope Operator, I want to monitor the SDP sub-system with a usable and polished Taranta dashboard that follows common design guidelines.

      Show
      As an AIV Engineer / Telescope Operator, I want to monitor the SDP sub-system with a usable and polished Taranta dashboard that follows common design guidelines.
    • Hide

      Updated dashboard for monitoring the SDP that

      1. resolves known problems with the current version,
      2. follows design guidelines that are agreed for dashboards, and
      3. improves the user experience (TBD how this is assessed).
      Show
      Updated dashboard for monitoring the SDP that resolves known problems with the current version, follows design guidelines that are agreed for dashboards, and improves the user experience (TBD how this is assessed).
    • Intra Program
    • 1
    • 1
    • 0
    • Team_NALEDI
    • Sprint 5
    • Hide

      1. The SDP Taranta dashboard was updated to fix some of the attributes not displaying correctly. The updated dashboard can be found in the SDP Integration repository.

      2. A set of recommendations for Taranta dashboards were drawn up they are available here.

      3.

      • Layout has been improved
      • Added Queue connector statistics attributes
      • Added subarray errors

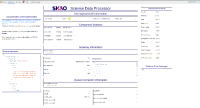
      The current version of the SDP Taranta dashboard has the following layout and properties:

      Show
      1. The SDP Taranta dashboard was updated to fix some of the attributes not displaying correctly. The updated dashboard can be found in the SDP Integration repository . 2. A set of recommendations for Taranta dashboards were drawn up they are available here . 3. Layout has been improved Added Queue connector statistics attributes Added subarray errors The current version of the SDP Taranta dashboard has the following layout and properties:
    • 24.6
    • Stories Completed, Integrated, Outcomes Reviewed, Satisfies Acceptance Criteria, Accepted by FO
    • PI25 - UNCOVERED

    Description

      See Feature frame on DP ART board.

      Context

      See Capabilities SS-155, SS-156 and SS-185.

      The SDP Taranta dashboard is fairly rudimentary and some of the current functionality may be broken (see the evaluation of the dashboard by the Maple team).

      Since we last worked on the dashboard, Taranta has acquired new functionality including "synoptic" views which use SVG and multiple layers to enable better-looking dashboards and enhance the user experience.

      References

      • MAP-90: Maple team's evaluation of dashboards

      Attachments

        Issue Links

          Structure

            Activity

              People

                m.ashdown Ashdown, Mark
                m.ashdown Ashdown, Mark
                Votes:
                0 Vote for this issue
                Watchers:
                2 Start watching this issue

                Feature Progress

                  Story Point Burn-up: (100.00%)

                  Feature Estimate: 1.0

                  IssuesStory Points
                  To Do00.0
                  In Progress   00.0
                  Complete68.0
                  Total68.0

                  Dates

                    Created:
                    Updated:
                    Resolved:

                    Structure Helper Panel