Details
-
Feature
-
 Could have
-
Obs Mgt & Controls
-
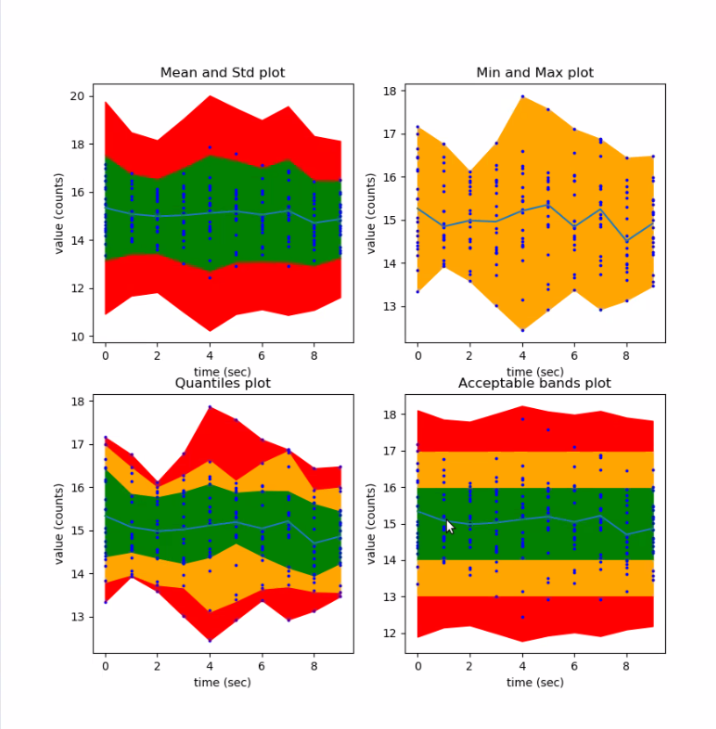
The user can display attributes that yield arrays of time-dependent values. These attributes cannot be viewed in dashboards otherwise.
While questionable as a choice from a design point of view (for the reasons that Nick mentioned above), for cases where a block of variables are provided in a single attribute, this visualization is appropriate.
Also, this opens the door for more ambitious display capabilities, like displaying statistical aggregations of such data points. For example:
- displaying a time series of means and std dev;
- displaying min and max;
- displaying quantiles;
- displaying ad-hoc constant thresholds.
See an example provided by Carlo in the attachment.
 The user can display attributes that yield arrays of time-dependent values. These attributes cannot be viewed in dashboards otherwise. While questionable as a choice from a design point of view (for the reasons that Nick mentioned above), for cases where a block of variables are provided in a single attribute, this visualization is appropriate. Also, this opens the door for more ambitious display capabilities, like displaying statistical aggregations of such data points. For example: displaying a time series of means and std dev; displaying min and max; displaying quantiles; displaying ad-hoc constant thresholds. See an example provided by Carlo in the attachment.
 -
-
3
-
0
-
-
Overdue
-
-
Taranta
-
Low G3
Description
Taranta users need to be able to plot an array of N timeseries, with data being provided by a Tango attribute whose values are N-dimensional arrays.
What we need is an extension of the Attribute Plot widget so that it accepts an attribute that provides an array on N numbers, and then the widget plots N timeseries, one for each index of the array.
Possibly with the ability to interactively select/deselect some of these N components. Each line in the plot can be interacted with using the mouse (eg mouse over displays numbers, clicking on a line hides it, labels of each line is its index in the array, clicking on the legend un-hides that line).
History
A while ago Joe Harvey said that:
Is there a way to get the attribute plot for an attribute that returns an array.
In my example I have the attribute fgpaTemperatures, which returns multiple temps, one for each fpga. I was hoping to each one alongside each other so you can get an idea of what the temp looks like over the course of a day.
However I'm not able to add the fpgaTemp attributes to the attribute plot (because its the wrong data type I imagine)
by Joe Harvey, on https://skao.slack.com/archives/CUPDD1KM5/p1696948203447729
Later on, Nick commented:
Looking at this I feel that each temperature should be it’s own attribute since it has a specific meaning. I suspect they are using an array because of lazy coding. As a user new to the system I suspect I won’t know that temp[3] is the inlet air temperature (or whatever it is), but if there was an attribute called InAirTemp (or whatever) I would have a chance.
and them Giorgio:
@Nick Rees: I hear you, but IMO this is a question regarding the API that a device should expose.
A different question is "should Taranta be able to plot a time series of an array of values?". And my leaning is in favour of this.
and Nick again:
Agree my point is about an API. Also agree that plotting a time series of an array of values is a reasonable ask, but I haven’t needed it much in my experience. The problem is if the API is hiding what are discrete scalars as an array, then all your tools have to have ways of handling this, since there is only one set of meta-data for an array, whereas every scalar has its own meta-data. In this instance, for example, if the alarm limits for every temperature is different, then there is no way of managing this.
